What Are CAGR and IRR in Real Estate — and Do They Actually Help You Invest Better?
· 11 min read
CAGR and IRR are two of the most important metrics in property investment. This guide explains what they mean, how to calculate them, when to use each one — and where they can mislead you.
Numbers tell stories in property investment. But only if you know which numbers to read, what they are actually measuring, and — crucially — where they can mislead you. Two metrics sit at the heart of serious property analysis in the UK and internationally: CAGR and IRR. They are frequently cited, often misunderstood, and sometimes misused.
This guide explains both clearly — what they measure, how to calculate them, and whether they truly help when evaluating a real estate investment.
1. Why Metrics Matter in Property Investment
Property investment decisions are often made on instinct: a sense that an area is improving, a feel that a price looks good, or confidence that rental demand is strong. Instinct has its place — but it cannot compare two investments objectively, account for the cost of time, or tell you whether the return justifies the risk.
That is what investment metrics do. There are many ways to analyse the profitability and investment returns of a project or property. In commercial real estate, two of the most common metrics used to measure performance are Compound Annual Growth Rate and Internal Rate of Return. Understanding both — and knowing when to apply each — sharpens every investment decision, whether you are evaluating a single buy-to-let or comparing a portfolio of opportunities.
2. What Is CAGR — and How Do You Calculate It?
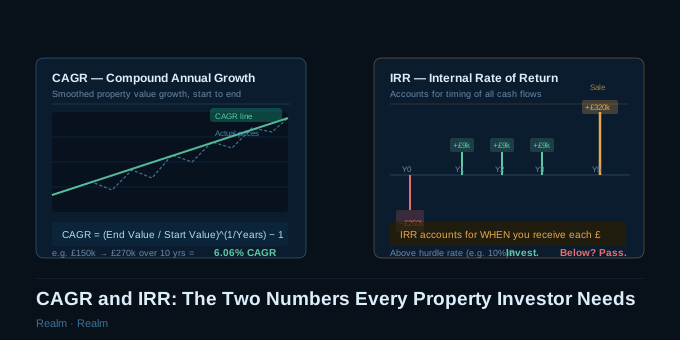
CAGR stands for Compound Annual Growth Rate. It answers a simple question: if a property's value grew from one figure to another over a given number of years, what was the equivalent smooth, consistent annual growth rate that would produce the same result?
The formula is:
CAGR = (End Value ÷ Start Value) ^ (1 ÷ Number of Years) − 1
A practical example: suppose you bought a property in 2015 for £150,000 and it is now worth £270,000 in 2025 — a ten-year hold. Plugging those figures in gives a CAGR of approximately 6.06%. That does not mean the property grew by exactly 6.06% in each of those ten years — in reality prices fluctuated, dipped in 2023, surged in 2021, and moved unevenly throughout. The CAGR as calculated will probably not be experienced in any given year. Despite market volatility, it tells you the average annual rate at which the investment grew over the entire holding period.
This smoothing effect is both CAGR's greatest strength and its most important limitation. CAGR smooths the path, making it suitable for communication and benchmarking, but it deliberately ignores the pattern of returns along the way.
3. CAGR in the Context of UK Property
Understanding what a "good" CAGR looks like requires anchoring it to real market data.
Over the long run, UK residential property has delivered average annual total returns — including rental yield minus costs — of approximately 8–10%. For price appreciation alone, most financial planners use 3–4% as a conservative nominal assumption for long-term projections, which equates to roughly 0.5–1% real growth after inflation.
Regional variation is dramatic, and this is where CAGR becomes a genuinely useful analytical tool. As of mid-2026, annual house price growth varies sharply across the UK: Wales is up 5.0%, Scotland up 4.9%, Northern Ireland up 7.5%, and the North East and North West both running at approximately 4.5–4.6%. At the other end, London is down 1.0% and the South East is flat.
Those annual figures are single-year snapshots. Apply CAGR over a ten or twenty-year window and the picture becomes more nuanced. Over the past 20 years, London property adjusted for inflation has seen just 0.5% annual real growth — barely above zero. Over the past five years, it has delivered a real-terms decline of 4.2% per year, translating to a cumulative real fall of 19.3%. These are not the numbers the London premium narrative typically presents.
CAGR helps assess historical performance and compare real estate against other asset classes. It allows investors to evaluate whether a specific property or postcode has outperformed or underperformed relative to regional or national benchmarks. Used this way — comparing a target postcode's ten-year CAGR against the regional average, for instance — it becomes a powerful screening tool before any money is committed.
4. What Is IRR — and How Does It Work?
Internal Rate of Return is a more complex but more complete metric. Where CAGR measures price growth from start to finish, IRR accounts for every cash flow that occurs during the hold period — the initial purchase cost, every month of rental income received, any capital expenditure along the way, and the eventual sale proceeds.
The internal rate of return gives investors a percentage that represents the annual growth rate of their investment. In technical terms, it is the discount rate at which the net present value of all cash flows — both in and out — equals zero.
The key insight IRR adds over CAGR is the time value of money. A pound received today is worth more than a pound received in five years, because today's pound can be invested and grow in the interim. IRR increases with earlier cash flows due to this reinvestment assumption. CAGR remains constant as it does not factor in when returns are received — only the start and end values. CAGR ignores time, which is one of the most expensive inputs in any investment.
A good IRR is one that exceeds the minimum acceptable rate of return — also called the hurdle rate or discount rate. If your hurdle rate is 10% but the IRR of a project is only 8%, that is not a good deal, regardless of how attractive the headline numbers look. Most serious UK property investors set hurdle rates of 8–15% depending on the risk profile of the asset.
5. A Worked Example: CAGR vs IRR Side by Side
To understand how the two metrics diverge in practice, consider a straightforward UK buy-to-let scenario.
The investment:
- Purchase price: £250,000 (Year 0)
- Annual rental income after costs: £9,000 per year for five years
- Sale price after five years: £295,000
CAGR calculation:
Using only the purchase price and sale price: CAGR = (£295,000 ÷ £250,000)^(1/5) − 1 = 3.35% per year. This captures only the capital appreciation — it completely ignores the £45,000 in rental income earned over the hold period.
IRR calculation:
Now include all cash flows:
- Year 0: −£250,000 (purchase)
- Years 1–5: +£9,000 per year (rent)
- Year 5: +£295,000 (sale proceeds)
The IRR that makes the net present value of these flows equal to zero comes out at approximately 8.2%. This is a very different number — and a much more accurate representation of the investment's performance, because it captures the full return including the income generated along the way.
Real estate money does not grow in one smooth line. You pay for the property, invest in improvement work, earn some rent, then sell. Money moves at different times and timing matters. Use IRR to judge the deal. Use CAGR to describe the value trend.
6. When to Use CAGR, When to Use IRR
These two metrics are not in competition — they answer different questions. The skill is knowing which question you need to answer at each stage of an investment decision.
Use CAGR when:
- Comparing long-run price growth across postcode sectors, regions, or property types
- Benchmarking a potential investment area against the national or regional average
- Describing the historical performance of a property or portfolio in simple terms
- Evaluating real estate against other asset classes such as equities or gilts
- Working with buy-and-hold strategies where cash flows stay fairly consistent and the primary driver of return is appreciation
Use IRR when:
- Evaluating a specific deal where rental income, financing costs, and sale proceeds all play a role
- Comparing two investment opportunities of different sizes or durations
- Modelling a flip, development, or value-add project where cash flows are irregular
- Analysing value-add commercial or residential projects with irregular cash flows across the investment period
- Deciding whether a deal clears your minimum required return threshold
In practice, a thorough property investment analysis will use both. CAGR sets the market context — what has this area historically delivered and what might it deliver going forward? IRR models the specific deal — does this particular transaction, with these cash flows, at this price, meet the return threshold?
7. The Limitations You Need to Know
Both metrics have blind spots that can lead investors astray if they are treated as definitive answers rather than analytical tools.
CAGR's limitations:
It hides volatility entirely. A property that fell 40% in year two and then recovered strongly over the following eight years can show the same CAGR as one that grew steadily throughout. The risk profile of those two journeys is completely different, but CAGR cannot distinguish between them.
It ignores all income. As the worked example above demonstrates, a CAGR based on purchase and sale price alone tells you nothing about the rental yield generated during the hold period. For income-focused buy-to-let investors, this is a significant omission.
It assumes a linear hold period. CAGR cannot model refinancing events, capital expenditure, partial disposals, or any other mid-period cash flow.
IRR's limitations:
IRR can be significantly affected by the timing of cash flows. Early positive cash flows can inflate IRR, potentially making shorter-term investments appear more attractive than they truly are. As a result, IRR might not always accurately represent real-world profitability, particularly when comparing projects of different durations.
IRR assumes all future cash flows will be reinvested at the IRR itself — which is rarely feasible in practice, especially in volatile markets. In some cases, projects with alternating positive and negative cash flows may produce multiple IRR values, leading to ambiguity.
IRR is also sensitive to the size of the initial investment, which can distort comparisons of the true profitability between properties of different price points.
8. Can IRR Be Manipulated?
This is an important question — particularly for anyone evaluating an investment opportunity presented by a fund manager, developer, or commercial property sponsor.
Because of its reliance on the timing of cash flows, IRR can be manipulated to appear higher by shifting the timing of cash inflows or shortening the period over which they occur.
Most commercial real estate investment returns follow a waterfall distribution model, where the sponsor and investors split cash flows based on preset IRR hurdles. The higher the IRR the sponsor delivers, the greater their share of the proceeds — creating a financial incentive to present the most favourable possible IRR figure.
Adjusting the time horizon or cash flow timing can lead to misleading IRR results that do not reflect actual returns. For this reason, other performance metrics should always be considered alongside IRR when evaluating an investment's profitability.
The practical implication: when an investment opportunity advertises a headline IRR, always ask how it was calculated. What assumptions were made about rental growth? What exit price was assumed? Over what time period? A well-constructed IRR model should be transparent about its inputs — if it is not, treat the number with scepticism.
9. What Else Should You Measure Alongside Them?
CAGR and IRR are powerful, but no single metric is sufficient. A complete investment analysis should also consider:
Gross and net yield — Annual rental income as a percentage of the property's value. Gross yield ignores costs; net yield (after mortgage, maintenance, management fees, and voids) is the figure that actually lands in your account. UK average gross yields run at approximately 5–7% depending on region, with northern cities typically offering stronger yields than London and the South East.
Return on Investment (ROI) — ROI measures total profitability as a percentage. Consider a £250,000 investment sold five years later for £295,000 with £45,000 in rental income received: the total ROI is 36%. Unlike IRR, ROI does not account for the time period over which the return was generated — a 36% ROI over five years and a 36% ROI over ten years are very different achievements.
Cash-on-cash return — The annual rental income as a percentage of the actual cash invested, rather than the property's full value. This is particularly relevant for leveraged investors using mortgage finance, because the cash invested is only a fraction of the asset value.
Equity multiple — Total cash returned divided by total cash invested. A property that returns £1.80 for every £1.00 invested has an equity multiple of 1.8x. This figure is simple and intuitive but, like ROI, is blind to time.
Used together, these metrics give a multi-dimensional view of a deal — one that no single number can provide on its own.
10. The Honest Verdict
CAGR and IRR are genuinely useful — but only if you understand what they measure and what they miss.
CAGR is the right tool for benchmarking markets, comparing regions, and tracking the historical performance of an area over time. At Signals BI, CAGR is built into our postcode sector intelligence — giving you a data-backed view of how each area has compounded over one, three, and five-year periods, so you can compare opportunities with a consistent, objective measure rather than relying on estate agent narratives.
IRR is the right tool for evaluating specific deals, particularly those involving rental income, leverage, and a defined exit. It is the professional standard in commercial property, institutional investment, and development finance — and for good reason. It captures what CAGR cannot: the economic reality that timing matters, and that a pound today is worth more than a pound tomorrow.
Neither metric replaces judgement, local knowledge, or a thorough due diligence process. But used correctly — and with a clear understanding of their limits — they transform property analysis from guesswork into evidence. In a market where the difference between a good deal and an average one can run to tens of thousands of pounds, that is a meaningful edge.
Want to explore historical CAGR data for any postcode sector in England and Wales? Start your free trial at signalsbi.com and generate your first property intelligence report today — no commitment required.
Frequently asked questions
What does CAGR mean in real estate?
CAGR (Compound Annual Growth Rate) is the smoothed equivalent annual growth rate that would take a property's value from its start price to its end price over a given number of years. It is calculated as (End Value / Start Value)^(1/Years) − 1.
What is IRR in property investment?
IRR (Internal Rate of Return) is the discount rate at which the net present value of all cash flows from a property investment — including the purchase price, rental income, capital expenditure and sale proceeds — equals zero. Unlike CAGR, it accounts for the timing and magnitude of every cash flow.
What is the difference between CAGR and IRR?
CAGR measures only the smoothed growth between a start value and an end value, ignoring any income or interim cash flows. IRR captures every cash flow over the holding period and weights them by when they occurred, so it reflects the time value of money.
What is a good CAGR for UK property?
Over the long run, UK residential property has delivered total returns of roughly 8–10% per year including net rental yield. For price appreciation alone, 3–4% nominal CAGR is a conservative long-term assumption, equating to roughly 0.5–1% real growth after inflation. Regional CAGR varies significantly.
What is a good IRR for UK property investment?
A good IRR exceeds your hurdle rate — the minimum return required to justify the risk. Most serious UK property investors set hurdle rates of 8–15% depending on whether the asset is core buy-to-let, value-add or development. An IRR below the hurdle rate is a poor deal regardless of how attractive the headline numbers look.
Can IRR be manipulated?
Yes. IRR is highly sensitive to the timing of cash flows, so shifting cash inflows earlier or shortening the holding period can inflate the headline number. When evaluating sponsor-led commercial deals, always ask what rental growth, exit price and time horizon were assumed in the IRR model.