UK Property Development in 2026: What's Happening, What's Expected, and How to Analyse New Builds
· 12 min read
The UK residential development market is navigating a tough 2026 — from the government's off-track 1.5 million homes target to sharp regional divides in land values and completions. Here's what's happening and how data can give you an edge when analysing new build opportunities.
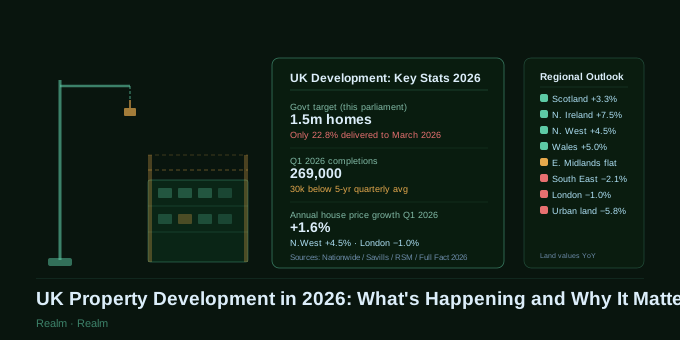
The UK residential development market enters mid-2026 in a state of managed tension. On one side sits a government with an ambitious housebuilding target, planning reforms designed to unlock land, and a clear political mandate to address the housing crisis. On the other sits a set of structural realities — high build costs, viability challenges on urban schemes, subdued buyer demand in parts of the country, and a widening gap between regional markets — that are proving resistant to political will alone.
For buyers, investors, and developers trying to make sense of the landscape, understanding what is actually happening — rather than what the headlines claim — is essential. Here is the clearest picture the current data provides.
1. The State of the UK Development Market Right Now
The first quarter of 2026 painted a mixed picture for UK residential property. After a relatively resilient finish to 2025, the first months of 2026 suggested a market that was finding its feet. Supply improved, giving buyers more choice, and pricing remained broadly positive year-on-year. However, by March, renewed macroeconomic and geopolitical uncertainty had begun to weigh on sentiment, tempering what had initially looked like a more confident start to the year.
On the supply side, stock levels rose notably. Zoopla reported that the average estate agent started 2026 with 32 homes for sale — the highest level at the start of a year for eight years. In London, stock was up 16% year-on-year, and in the South East it was up 9%, reflecting a greater carry-over of unsold homes from late 2025.
Transaction volumes tell a more cautious story. Q1 completions reached 269,000 — around 30,000 below the five-year quarterly average. HMRC''s provisional seasonally adjusted estimate for UK residential transactions in January 2026 was 94,680, down 5% on December 2025 and marginally lower than January 2025.
On price, the four major house price indices showed values edging upwards in Q1 2026 by an average of 1.6%, with rises generally between 0.1% and 3% depending on the region. Modest growth, but growth nonetheless — the outright corrections some analysts feared have not materialised.
2. The 1.5 Million Homes Target — and Why It Matters to Everyone
No discussion of UK development in 2026 can avoid the government''s headline commitment: 1.5 million new homes in England by the end of this Parliament, no later than August 2029.
The ambition is genuinely significant. Under the motto "get Britain building again", the Labour government has laid out its plans through planning reform, the release of grey belt land, and the reintroduction of mandatory housing targets for local authorities. The Planning and Infrastructure Bill, which recently received Royal Assent, enacts reforms to the planning system designed to make it easier and quicker to build new homes and national infrastructure.
The delivery reality is considerably less encouraging. Between 9 July 2024 and 15 March 2026, there was a net addition of 342,100 homes — around 22.8% of the total 1.5 million target. Based on this rate of building, from March 2026 it would take over five and a half more years for the pledge to be met — meaning the government is currently rated as "off track" by most independent analysts.
Housing starts in Q2 2025 were still 22.5% below pre-pandemic levels, highlighting the scale of the catch-up required. Supply-side reform alone will not hit the 1.5 million target without also unlocking buyer demand.
Savills forecasts completions reaching only 166,000 in 2028–29 — well below the annual run rate required to hit the government''s ambition. The constraint is not primarily planning; it is demand. The expected appetite from individual buyers, investors, and housing associations to absorb new homes is a key limiting factor on housebuilder activity.
Why does this matter beyond policy circles? Because the supply shortfall has direct implications for property values, rental demand, and where development activity is concentrated. Areas where the government successfully unlocks delivery will see increased supply competing with existing stock — compressing price growth. Areas where delivery continues to fall short will maintain the structural supply deficit that has underpinned UK property values for decades.
3. Regional Divergence: Where Development Is Active and Where It Has Stalled
The most important theme in the development market right now is not the national average — it is the widening gap between regional markets. The UK development landscape in 2026 is not one market; it is several running at very different speeds.
The land market has continued to experience regional divergence over the first quarter of 2026. Sales rates remain muted in large parts of the South East and East of England, prompting caution from housebuilders, while a robust housing market in the North of the country and parts of the East Midlands has resulted in continued activity and good competition for sites.
On greenfield land values, the picture is similarly divided. Overall greenfield values fell by an average of just −0.9% across the UK in Q1 2026, but regional performance varied from −2.1% in the South East to +3.3% in Scotland.
The urban land market is under considerably more pressure. There has been little appetite for flat-led schemes across most of the country due to ongoing viability challenges, and as a result urban land values fell by −1.4% in Q1 2026, bringing annual falls to −5.8%. High build costs and building safety regulations continue to pose a significant threat to scheme viability. London bucked the trend, with values in both Outer and Central London holding steady.
On price growth, Northern Ireland leads all UK regions at +7.5% annual growth, followed by Wales at +5.0%, Scotland at +4.9%, and the North West and North East both running at approximately 4.5–4.6%. At the other end, London is down −1.0% and the South East is broadly flat.
The practical implication for developers and investors is clear: the North and devolved nations are where both the value momentum and the development economics currently make the strongest case. The South East and urban flatted schemes remain challenged — and are likely to remain so until build cost inflation stabilises meaningfully.
4. New Build Supply and What It Means for Buyers and Investors
Against this backdrop, what is actually being built — and where?
2026 marks the first full year of "Freedom to Buy", which makes the Mortgage Guarantee Scheme permanent, helping first-time buyers access higher loan-to-value mortgages on new build homes. This is a meaningful demand-side lever specifically targeted at new build purchases, and it provides a degree of floor under developer sales rates for schemes targeting first-time buyers.
Regions such as the Midlands and North West may see steadier delivery of new homes due to lower land costs and more flexible planning environments. If planning reforms, modern methods of construction adoption, and stronger government intervention align in the second half of 2026, the year may mark a turning point in addressing Britain''s structural housing deficit.
For buyers considering new build purchases, the current environment offers some genuine advantages. Stock levels are at multi-year highs, developers are incentivised to sell, and the new build premium — the price differential between a new property and an equivalent second-hand home — has compressed in many markets as developer pricing has had to adjust to the affordability environment.
For investors, the new build yield picture requires careful analysis by postcode. In high-demand rental markets — city centres, university towns, regeneration zones in northern cities — new build buy-to-let can still deliver strong yields. In oversupplied markets or areas where second-hand rental stock is plentiful, new build premiums may take years to recover through capital growth.
5. The Challenges Facing Developers in 2026
Three structural challenges are shaping the development market this year more than any others.
Build cost inflation. After several years of acute pressure, build cost inflation appeared to stabilise towards the end of 2025. Liquidity in the development finance market improved towards the end of 2025 and into 2026, as debt costs decreased, investment yields held firm, and build cost inflation appeared to have stabilised. However, there is now an air of uncertainty around the impact of geopolitical tensions on material prices and the cost of debt.
Viability on flatted urban schemes. The combination of building safety regulations — significantly tightened following the Grenfell inquiry — higher labour costs, and compressed sales values in many urban markets has made flatted schemes economically unworkable in many locations. Urban schemes in the regions face the same challenges as London''s land market, with high build costs and building safety regulations posing a threat to scheme viability across most of the country.
Demand-side affordability. A primary cause of weak housing starts is soft demand. Residential buyers, private landlords, and social housing providers are purchasing at lower rates, largely due to high interest rates straining affordability and undermining investment cases. The Bank of England base rate sits at 3.75% as we enter Q2 2026, with mortgage rates just under 5%. The market expects further rate movement this year, but the direction and pace remain uncertain.
6. What to Expect for the Rest of 2026
Forecasters broadly agree on the shape of the market through the remainder of this year, with RSM''s housing tracker providing some of the clearest guidance.
House price growth is expected to lag wage growth and inflation in 2026, with a forecast of just 1% nationally. Some regions such as the North West, Yorkshire and Humber, and the West Midlands may see increases of 3–4%, but London and much of the South East will see minimal growth. Housing volumes are expected to stagnate in Q2 before returning in later quarters of 2026.
The risk picture has shifted since the start of the year. The geopolitical situation in the Middle East — and its potential impact on energy and material costs — has introduced uncertainty that was not in most forecasters'' base cases at the beginning of 2026. The market expects the Bank of England to make further rate adjustments this year, with inflation potentially reaching 4% by the end of 2026 — a scenario that would put renewed pressure on mortgage affordability and development viability.
On the positive side, mortgage approvals have returned to near pre-pandemic levels, indicating genuine buyer demand rather than speculative activity. The largest January increase in asking prices ever recorded on Rightmove, at +2.8%, suggests sellers are entering the market with reasonable confidence.
The most likely scenario for the second half of 2026 is one of gradual improvement in transaction volumes, continued regional divergence in price performance, and modest acceleration in northern and midlands development activity — while southern markets and urban flatted schemes remain under pressure.
7. How to Use Data to Analyse New Build Opportunities
Whether you are a buyer evaluating a new development, an investor assessing a new build buy-to-let, or a developer scoping a potential site, data is the most reliable guide in a market this divided.
Here is where property intelligence genuinely changes the quality of decisions around new builds.
Understand the price baseline before you accept a developer''s valuation. New build developers set asking prices based on their own cost stack and profit targets — not necessarily on what the local market will support. Before committing, run a postcode sector report to understand what equivalent properties have actually sold for in the area over the past six to twelve months. If the new build premium is more than 5–10% above comparable second-hand stock, model carefully how long it will take to recover that premium through capital growth.
Check transaction volume trends, not just price trends. A postcode sector with rising average prices but falling transaction volumes is one where fewer sales are occurring at increasingly stretched price points — a potential warning sign. A sector with rising volumes and modest price growth is typically healthier. Signals BI''s postcode intelligence reports give you both figures in a single view.
Assess the rental yield picture with live data. For buy-to-let investors, developer-supplied yield projections are almost always optimistic — they use headline rental estimates rather than net achieved rents after voids, management fees, and maintenance. Cross-reference the developer''s rental figure against actual current listings and recent achieved rents in the postcode sector before accepting it at face value.
Look at the EPC picture for the surrounding area. New builds are typically rated A or B — a genuine competitive advantage as MEES 2030 approaches and the cost of improving older stock mounts. In an area where the existing housing stock is predominantly D or E rated, a new build''s energy efficiency becomes a meaningful differentiator for both tenants and future buyers. Signals BI''s EPC data layer shows you the distribution of ratings across a postcode sector, helping you contextualise where a new build sits relative to local competition.
Research planning applications in the vicinity. A new build opportunity in an area with several large residential schemes recently approved could see its local market flooded with similar stock over the next three to five years — compressing both capital values and rental rates. Checking the local planning pipeline is a step most buyers and investors skip entirely, and one that can make a significant difference to long-term return assumptions.
The UK development market in 2026 is not uniformly difficult or uniformly promising. It is a market of sharp contrasts — between north and south, between greenfield and urban, between schemes that work and those that do not. Data does not remove uncertainty, but it replaces the guesswork with evidence — and in a market this divided, that is a meaningful advantage.
Want to analyse price trends, transaction volumes, EPC data, and planning activity for any postcode sector in England and Wales? Start today at signalsbi.com and generate your first property intelligence report today.
Frequently asked questions
Is the UK government on track to deliver 1.5 million new homes by 2029?
No. Between 9 July 2024 and 15 March 2026 there was a net addition of around 342,100 homes — about 22.8% of the 1.5 million target. At the current rate it would take more than five and a half further years to meet the pledge, so independent analysts currently rate the government as off track.
Which UK regions are seeing the strongest residential development activity in 2026?
Northern England, the East Midlands and the devolved nations are leading. Northern Ireland is showing +7.5% annual price growth, Wales +5.0%, Scotland +4.9% and the North West/North East both around 4.5–4.6%. Greenfield land values in Scotland rose 3.3% in Q1 2026, while the South East fell 2.1%.
Why are urban flatted schemes struggling in 2026?
High build costs, tighter post-Grenfell building safety regulations, higher labour costs and compressed urban sales values have made many flat-led schemes unviable. Urban land values fell 1.4% in Q1 2026 and 5.8% over the year, with London the main exception.
What is Freedom to Buy and how does it affect new build demand?
2026 is the first full year of Freedom to Buy, which makes the Mortgage Guarantee Scheme permanent. It helps first-time buyers access higher loan-to-value mortgages on new build homes, providing a meaningful demand-side floor for developers targeting first-time buyers.
How should investors evaluate a new build buy-to-let in 2026?
Cross-check the developer pricing against recent comparable sold prices in the postcode sector, look at transaction volume trends (not just price trends), validate rental yield assumptions against live listings and achieved rents, review the local EPC distribution, and check the planning pipeline for nearby schemes that could add competing supply.