The High Yield Trap: A 9.28% Rental Yield vs a 0.22% CAGR in Stoke-on-Trent
· 9 min read
A 9.28% gross rental yield in Stoke-on-Trent's ST6 3 postcode looks irresistible — until you check the ten-year capital growth rate. Here's the data-driven truth behind the high-yield trap, and how to tell income plays from growth plays.
In the world of property investment, a 9.28% gross rental yield is the number that gets the phone ringing. In a market where national averages hover between 4% and 6%, such a figure acts as a siren song, luring investors into areas they might otherwise never consider. One such area is the ST6 3 postcode, specifically the neighbourhoods of Moorcroft, Sneyd Green and Burslem in Stoke-on-Trent.
1. The Siren Song of the 9% Yield
On paper, the opportunity looks exceptional. However, as a strategist, a high yield should never be read as a green light — it is a question that demands investigation. Is this a genuine wealth-building opportunity, or is the high yield merely compensation for systemic risks that will paralyse your capital?
2. It is About the Price, Not the Rent
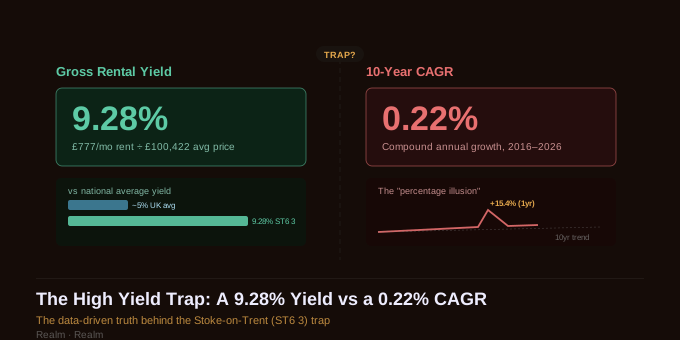
The maths behind the ST6 3 yield is deceptively simple: an average monthly rent of £777 (roughly £9,324 per year) against an average sold price of £100,422.
The first myth to dismantle is that this yield is driven by high rental demand. It is not. A £777 rent is modest by any national standard. This yield is a function of the exceptionally low entry price. This is a classic renter-heavy market where 74% of homes are either social or private rentals, creating a steady pool of tenants but a low ceiling for property value.
Furthermore, investors must remember that gross is not what you keep. That 9.28% headline figure evaporates quickly once you subtract management fees, insurance and the higher maintenance costs associated with older, lower-value stock. Once you account for tax and unavoidable void periods, your net return is significantly lower than the siren song suggests.
“A high yield is usually a story about cheap property, not expensive rent.”
3. The 0.22% Problem: Why the “Ten-Year Line” Matters
The most dangerous trap in real estate is the short-term spike. In the last 12 months, ST6 3 saw a 15.4% increase in property values. To the amateur, this looks like the start of a boom. To the strategist, it is a “Percentage Illusion.”
In low-value markets, small movements in actual pounds are reflected as double-digit percentage gains. A modest price rise on a sub-£100,000 base looks like a rally, but the “long line” — the ten-year Compound Annual Growth Rate from 2016 to 2026 — is a staggering 0.22%. Effectively, capital growth is flat. Over a decade, your asset has barely moved in value.
The Myth of the Trend. One strong year is not a trajectory; it is an outlier. This is a classic low-value trap: always analyse the ten-year CAGR before believing the narrative of a short-term spike.
4. High Yield Is a Payment for Risk
The market does not hand out 9% yields for nothing. In ST6 3, that percentage is a “risk payment” for taking on a specific demographic and economic profile:
- 37% of residents hold no formal qualifications
- 49% economic activity levels (well below the national average)
- 74% rental density, meaning the market is dominated by transient occupiers rather than invested owners
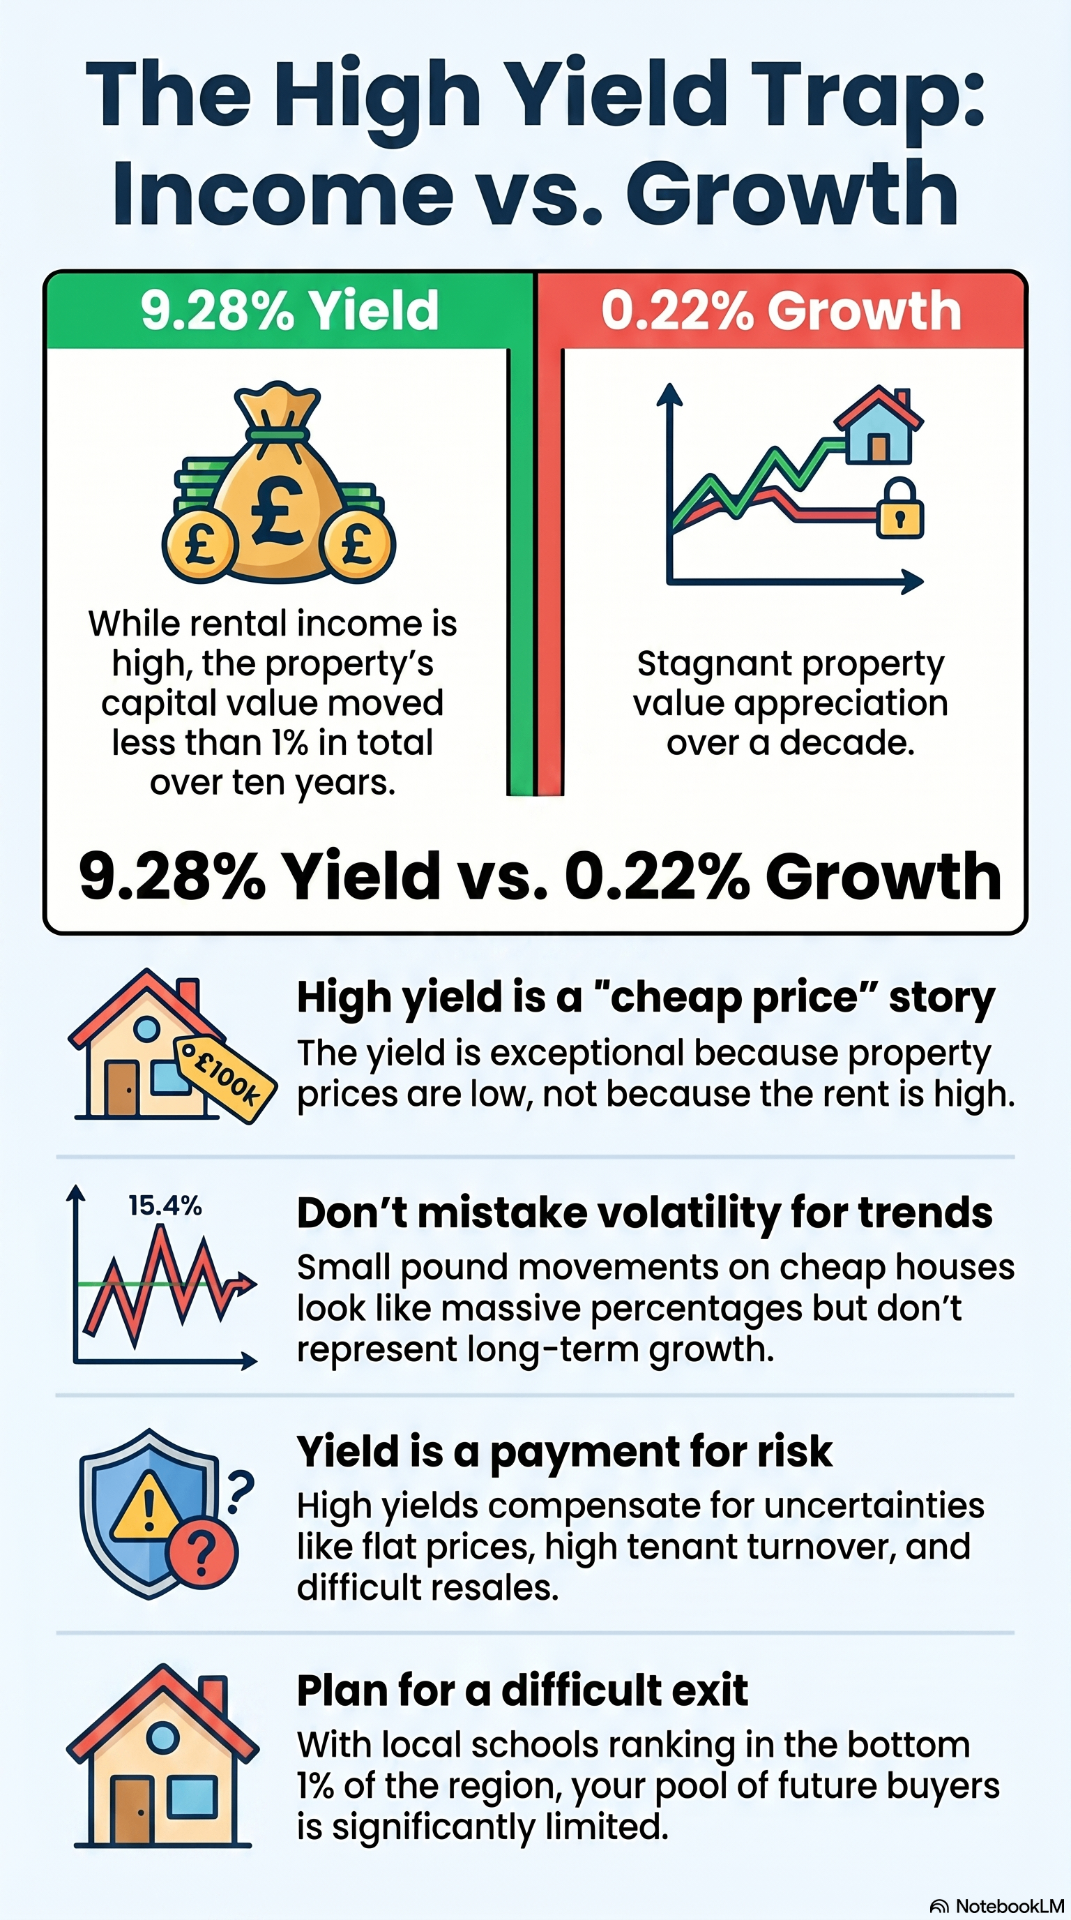
A high yield is a value signal, not a quality one. It is the market’s way of compensating you for the uncertainty of the area, higher tenant turnover and the inevitable “exit problem.”
5. The Invisible Hurdle: Pricing in the Exit
While you can collect rent every month, your ultimate return depends on your ability to sell. This is where the ST6 3 data reveals its most significant deficiency. While transport links (better than 71% of the region) and green space (better than 86%) are strong, the school ratings are catastrophic.
The local schools perform better than just 1% of the West Midlands, and the nearest primary school is currently near full capacity. This is not just a social metric; it is an investment hurdle. When an area lacks quality education and “everyday essentials” (rated at a fair but uninspiring 55%), you shrink your future buyer pool. You may find it easy to rent, but you will find it incredibly difficult to liquidate the asset to an owner-occupier who will pay a premium.
6. Income vs Growth: You Usually Only Get One
Investment is a game of trade-offs. High-yield areas offer immediate cash flow but suffer from stagnant price growth. Low-yield areas are expensive to enter but offer the long-term wealth of capital appreciation. ST6 3 sits firmly on the income side of the fence. The return here is generated by the tenant, not the property.
“The mistake is buying a yield like this and expecting capital growth to come along for free. You are usually choosing one or the other.”
7. Conclusion: A Specific Plan for a Specific Number
Is ST6 3 a “bad” buy? Not necessarily — if you have the right strategy. With a 92.6% planning approval rate and falling crime rates (both violent crime and anti-social behaviour dropped month-on-month in recent data), there are signs of localised stability.
This postcode is a fair fit for social housing providers or income-focused landlords who prioritise reliable occupancy and monthly checks over long-term wealth building. However, if you are looking for an asset that will appreciate and provide a lucrative exit in ten years, the 0.22% growth line is a warning you cannot afford to ignore.
The Strategy Fit
- Income Play: Stable demand and 92.6% planning approval make this viable for cash-flow-heavy strategies.
- Growth Play: Avoid. The school capacity issues and 0.22% CAGR indicate a stagnant capital future.
Before you commit your capital, ask yourself: are you looking for a monthly cheque today, or a larger exit tomorrow? In Moorcroft and Sneyd Green, the data says you cannot have both.
Want to check the real ten-year CAGR before you buy into a high-yield postcode? Create a report at welcome and generate your first property intelligence report today.
Frequently asked questions
Why is the rental yield in ST6 3 Stoke-on-Trent so high?
The 9.28% gross yield is driven almost entirely by the low average sold price of around £100,422, not by exceptional rents. Average rent is a modest £777 per month, so the yield reflects a cheap entry price in a renter-heavy market (74% of homes are social or private rentals) rather than strong rental demand.
What does a 0.22% 10-year CAGR mean for a property investor?
It means that, compounded annually from 2016 to 2026, capital values in ST6 3 have barely moved. Short-term spikes (such as the recent 15.4% one-year jump) can look like a boom on a low base, but the ten-year line shows the underlying trend is effectively flat — so the return profile is income-only, not growth.
Is ST6 3 a good buy-to-let postcode?
For income-focused landlords and social housing providers it can work: there is steady tenant demand, a 92.6% planning approval rate and falling crime. But for investors seeking capital appreciation and a strong exit, weak school ratings (better than only 1% of the West Midlands) and 0.22% 10-year CAGR make it a poor growth play.
How can I check the real 10-year CAGR for any UK postcode?
Generate a Signals BI postcode intelligence report at signalsbi.com. Each report includes the 10-year compound annual growth rate alongside yields, demographics, school and crime data, so you can compare income vs growth before committing capital.