The Leeds Housing Market: Why LS2 7's Volatile Prices Hide a Steady 6.45% Decade of Growth
· 9 min read
LS2 7 in Leeds has swung from −21.5% to +80.7% in a year — but the ten-year trend tells a calmer, more profitable story. Here's the data-driven truth behind Leeds city centre's most volatile postcode.
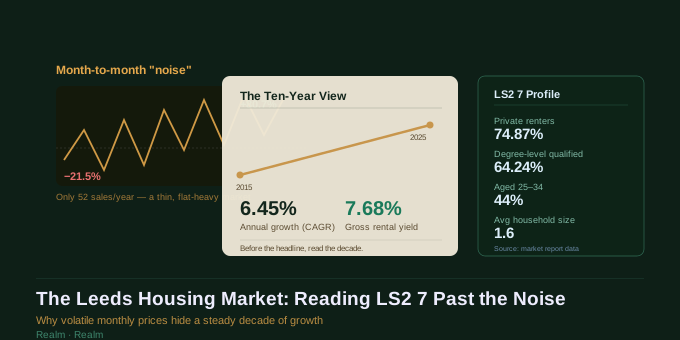
Leeds city centre has one of the most attention-grabbing price charts in the North of England — for entirely the wrong reasons. Look at the monthly figures for the LS2 7 postcode sector over the past six to twelve months and you will see prices that swung from −21.5% in one period to +80.7% in another. To an inexperienced eye, this looks like chaos. To a strategist, it is a market signal that needs decoding before it can be trusted.
1. The Problem: Volatility "Noise"
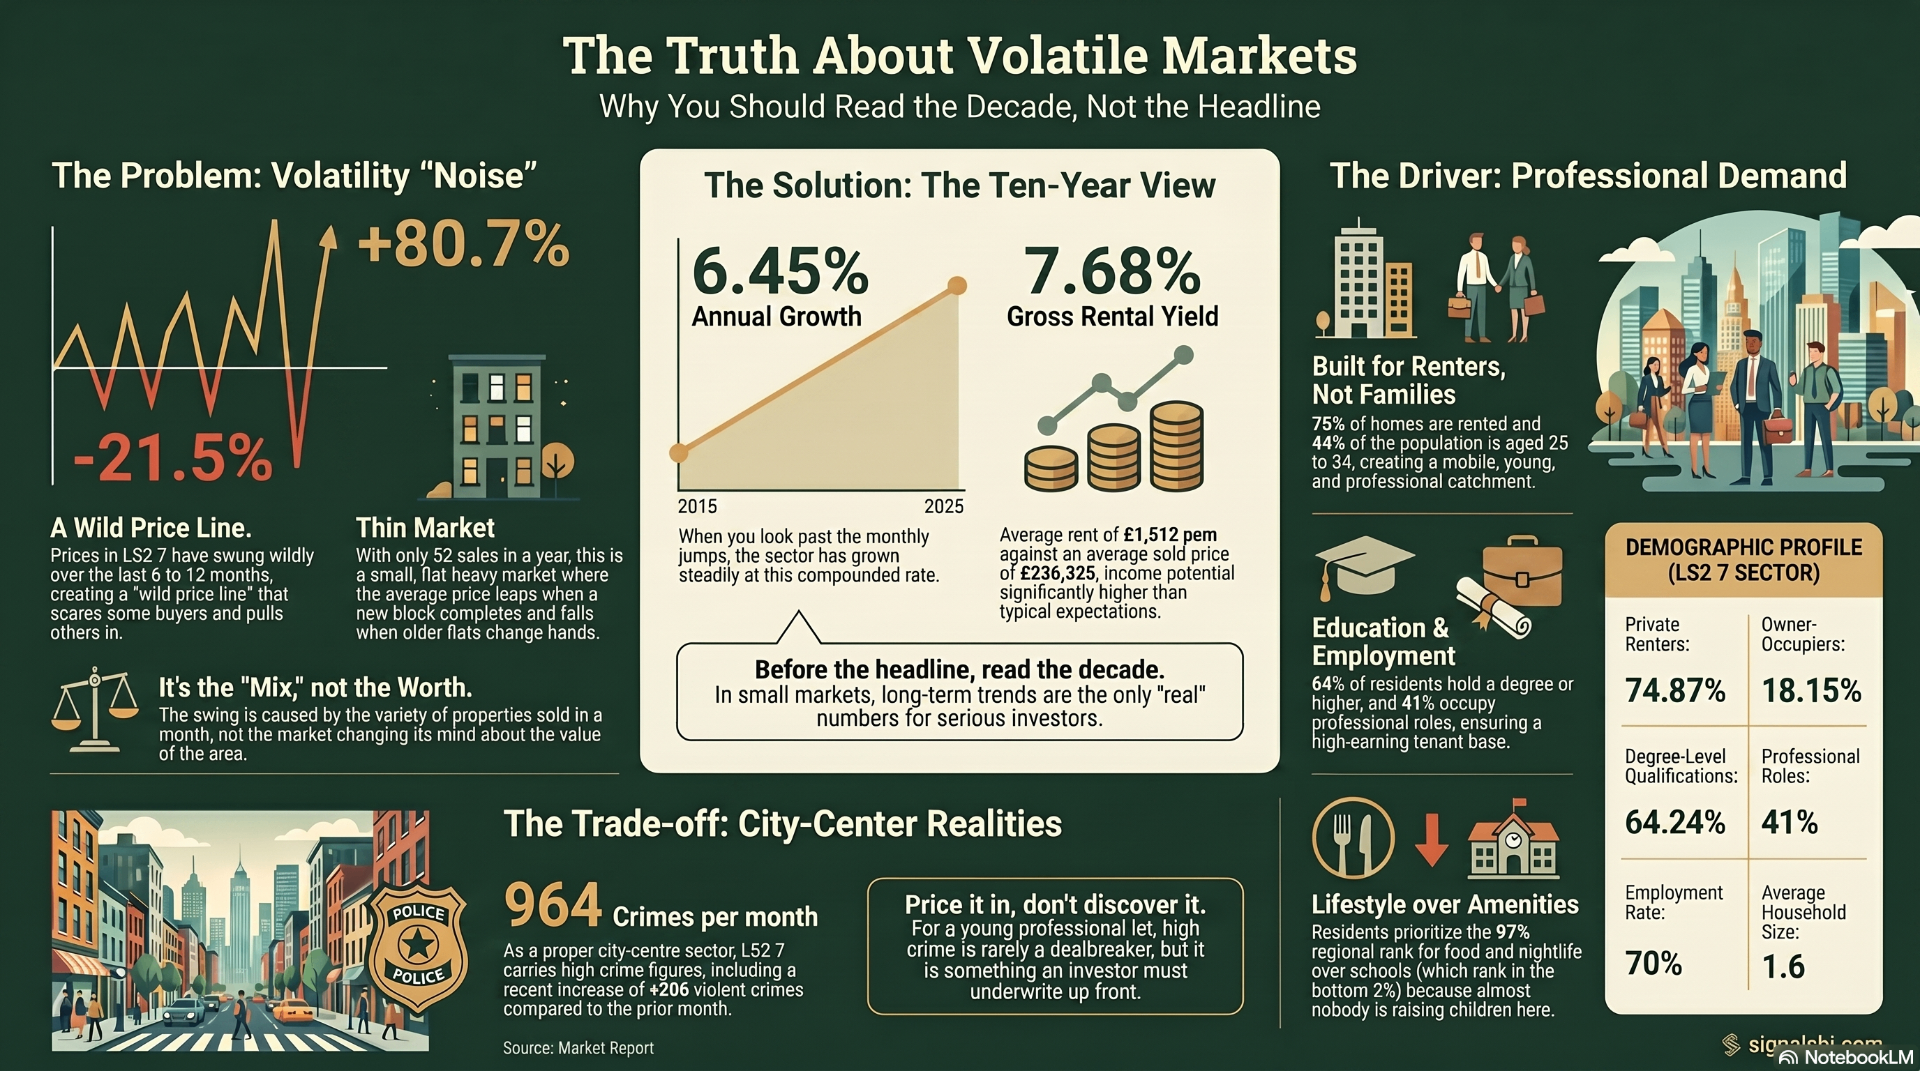
- A wild price line. Prices in LS2 7 have swung wildly over the last six to twelve months, creating a "wild price line" that scares some buyers and pulls others in.
- Thin market. With only 52 sales in a year, this is a small, flat-heavy market where the average price leaps when a new block completes and falls when older flats change hands.
- It''s the "mix," not the worth. The swing is caused by the variety of properties sold in a month, not the market changing its mind about the value of the area.
This last point is the one most amateur investors miss entirely. When a postcode sector records only a handful of sales each month, the mix of what happens to sell — a brand-new one-bed in a freshly completed tower one month, a tired ex-rental two-bed the next — will move the average price wildly, even if the underlying value of the area has not changed at all.
2. The Solution: The Ten-Year View
Strip out the monthly noise and look at the trend over a full decade, and LS2 7 tells a very different story.
When you look past the monthly jumps, the sector has grown steadily at a compounded rate of 6.45% annual growth between 2015 and 2025.
That figure matters because it is calculated the right way — as a Compound Annual Growth Rate (CAGR) across the full ten-year period, rather than read off a single noisy month. It smooths out the spikes and dips caused by the small sample size and gives a genuine sense of how the area has actually performed for anyone who held a property there over the period.
Alongside the capital growth, the income side of the equation is equally compelling. Average rent of £1,512 per month against an average sold price of £236,325 produces a gross rental yield of 7.68% — income potential significantly higher than typical expectations for a city centre location of this kind.
Put together: a city centre Leeds postcode delivering close to 6.5% annual capital growth and nearly 7.7% gross yield is a genuinely strong combination — one that is easy to miss if you only look at the volatile headline price movements. Before the headline, read the decade. In small markets, long-term trends are the only "real" numbers for serious investors.
3. The Driver: Professional Demand
Understanding why LS2 7 behaves the way it does requires understanding who actually lives there. This is not a family suburb — it is a postcode built almost entirely around young, mobile, professional renters.
75% of homes are rented and 44% of the population is aged 25 to 34, creating a mobile, young, and professional catchment.
The education and employment profile reinforces this picture clearly. 64% of residents hold a degree or higher, and 41% occupy professional roles, ensuring a high-earning tenant base.
| Metric | LS2 7 |
|---|---|
| Private renters | 74.87% |
| Owner-occupiers | 18.15% |
| Degree-level qualifications | 64.24% |
| Professional roles | 41% |
| Employment rate | 70% |
| Average household size | 1.6 |
The combination of a near-75% private rental share and a 64% degree-educated population tells you precisely what kind of asset this is: a city centre rental market driven by young professionals, not a family-housing area. That has direct implications for the kind of stock that performs well here — one and two-bedroom flats close to the centre, rather than larger family houses, and tenants who are likely to be reliable earners but who will also move on relatively quickly given the average household size of just 1.6.
4. The Trade-off: City-Centre Realities
No honest analysis of a city centre postcode can ignore the trade-offs that come with that location. LS2 7 has them, and they are worth pricing in rather than discovering later.
964 crimes per month. As a proper city-centre sector, LS2 7 carries high crime figures, including a recent increase of +206 violent crimes compared to the prior month.
This is the cost of being a genuine city centre location — denser footfall, more nightlife, more transient population, and the higher crime figures that typically accompany all three. Price it in, don''t discover it. For a young professional let, high crime is rarely a dealbreaker, but it is something an investor must underwrite up front.
The lifestyle priorities of the people who actually live here confirm this is a deliberate trade-off rather than an oversight. Residents prioritise the 97% regional rank for food and nightlife over schools (which rank in the bottom 2%) because almost nobody is raising children here.
That bottom-2% school ranking would be a significant red flag in a family-focused suburb. In LS2 7, it is almost irrelevant — because the tenant base buying into this area is not looking for catchment areas. They are looking for a short commute, good bars and restaurants, and a flat that suits a single professional or a young couple without children. Judging this postcode against family-market criteria would be a fundamental misread of what it actually is.
5. What This Means for Investors
LS2 7 is a clear example of why headline monthly data can mislead, and why a longer, more disciplined view of any postcode sector matters before committing capital.
The volatility itself is not a danger sign — it is a function of a thin, flat-heavy market where the mix of what sells each month swings the average. The real signal sits in the ten-year CAGR of 6.45% and the 7.68% gross yield, both of which point to a postcode that has quietly delivered strong, compounding performance for long-term holders.
The demographic profile — overwhelmingly young, professional, and rented — tells you exactly which strategy fits. This is an income-and-growth combination postcode suited to buy-to-let investors targeting one and two-bedroom flats for young professional tenants, not an area to evaluate against family-housing metrics like school quality.
The crime figures and the lifestyle profile are two sides of the same coin: a genuine city centre location, with everything that brings. For the right investor — one targeting professional renters rather than families, and comfortable underwriting city centre crime statistics rather than being surprised by them — LS2 7 represents a well-evidenced case of a postcode that rewards patience and a decade-long lens over headline-chasing.
Want to see the full ten-year price and yield trend for any Leeds postcode sector before you invest? Start your free trial at signalsbi.com and generate your first property intelligence report today.